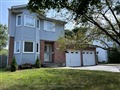
2393 Sandy Tr
$758,768
Comparative Market Analysis
Jul 4, 2025
NOT AN ACTIVE LISTING
Historical Performance
| Period | $ Change | % Change |
| 1 Day | +$255 | +0.034% |
| 7 Days | +$331 | +0.044% |
| 30 Days | -$788 | -0.104% |
| 3 Months | -$1,112 | -0.146% |
| 6 Months | +$14.1k | +1.90% |
| 1 Year | -$30.6k | -3.87% |
| 3 Years | +$150k | +24.6% |
| 5 Years | +$260k | +52.1% |
| 10 Years | +$491k | +183% |
List My Property
Real Estate Statistics
Financing Solutions
AS SEEN ON


Are You a Licensed Real Estate Agent or Broker?