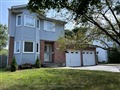
2337 Sandy Tr
$649,040
Comparative Market Analysis
Jul 4, 2025
NOT AN ACTIVE LISTING
Historical Performance
| Period | $ Change | % Change |
| 1 Day | +$218 | +0.034% |
| 7 Days | +$276 | +0.043% |
| 30 Days | -$698 | -0.107% |
| 3 Months | -$958 | -0.147% |
| 6 Months | +$12.3k | +1.93% |
| 1 Year | -$24.8k | -3.68% |
| 3 Years | +$136k | +26.4% |
| 5 Years | +$219k | +50.9% |
| 10 Years | +$379k | +140% |
List My Property
Real Estate Statistics
Financing Solutions
AS SEEN ON


Are You a Licensed Real Estate Agent or Broker?