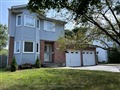
2267 Sandy Tr
$705,741
Comparative Market Analysis
Jul 4, 2025
NOT AN ACTIVE LISTING
Historical Performance
| Period | $ Change | % Change |
| 1 Day | +$237 | +0.034% |
| 7 Days | +$439 | +0.062% |
| 30 Days | -$84 | -0.012% |
| 3 Months | +$1,105 | +0.157% |
| 6 Months | +$17.7k | +2.57% |
| 1 Year | -$17.6k | -2.43% |
| 3 Years | +$178k | +33.6% |
| 5 Years | +$307k | +77.1% |
| 10 Years | +$508k | +258% |
List My Property
Real Estate Statistics
Financing Solutions
AS SEEN ON


Are You a Licensed Real Estate Agent or Broker?