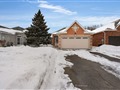
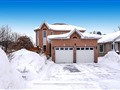
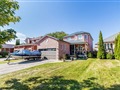
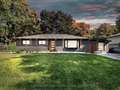
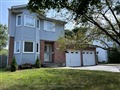
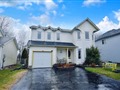
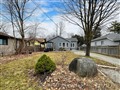
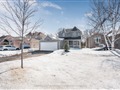
2123 Osbond Rd
$1,011,340
Comparative Market Analysis
Jul 2, 2025
NOT AN ACTIVE LISTING
Historical Performance
| Period | $ Change | % Change |
| 1 Day | +$339 | +0.034% |
| 7 Days | +$1,582 | +0.157% |
| 30 Days | +$5,093 | +0.506% |
| 3 Months | +$23.3k | +2.36% |
| 6 Months | +$83.3k | +8.97% |
| 1 Year | +$122k | +13.7% |
| 3 Years | +$325k | +47.3% |
| 5 Years | +$372k | +58.2% |
| 10 Years | +$582k | +136% |
List My Property
Real Estate Statistics
Financing Solutions
Browsing History
1194 Booth Ave, Innisfil
6 seconds ago
1175 Booth Ave, Innisfil
10 seconds ago
AS SEEN ON


Are You a Licensed Real Estate Agent or Broker?