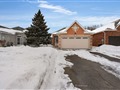
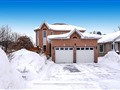
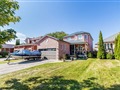
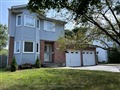
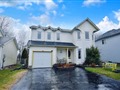
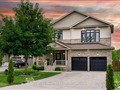
2095 Osbond Rd
$882,253
Comparative Market Analysis
Jul 2, 2025
NOT AN ACTIVE LISTING
Historical Performance
| Period | $ Change | % Change |
| 1 Day | +$296 | +0.034% |
| 7 Days | +$339 | +0.038% |
| 30 Days | -$1,134 | -0.128% |
| 3 Months | -$1,975 | -0.223% |
| 6 Months | +$15.1k | +1.74% |
| 1 Year | -$38.4k | -4.17% |
| 3 Years | +$167k | +23.4% |
| 5 Years | +$290k | +48.9% |
| 10 Years | +$532k | +152% |
List My Property
Real Estate Statistics
Financing Solutions
Browsing History
1173 Booth Ave, Innisfil
6 seconds ago
41 Macnaughton Dr, Innisfil
11 seconds ago
AS SEEN ON


Are You a Licensed Real Estate Agent or Broker?