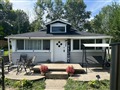
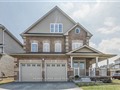
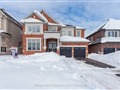
2073 Inglewood Dr
$965,139
Comparative Market Analysis
Jun 27, 2025
NOT AN ACTIVE LISTING
Historical Performance
| Period | $ Change | % Change |
| 1 Day | +$324 | +0.034% |
| 7 Days | +$518 | +0.054% |
| 30 Days | -$493 | -0.051% |
| 3 Months | +$511 | +0.053% |
| 6 Months | +$22.8k | +2.42% |
| 1 Year | -$24.5k | -2.48% |
| 3 Years | +$235k | +32.3% |
| 5 Years | +$340k | +54.4% |
| 10 Years | +$565k | +141% |
List My Property
Real Estate Statistics
Financing Solutions
AS SEEN ON


Are You a Licensed Real Estate Agent or Broker?