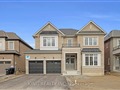
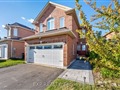
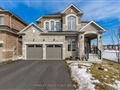
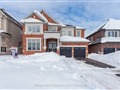
2067 Lilac Dr
$689,352
Comparative Market Analysis
Jun 29, 2025
NOT AN ACTIVE LISTING
Historical Performance
| Period | $ Change | % Change |
| 1 Day | +$231 | +0.034% |
| 7 Days | +$564 | +0.082% |
| 30 Days | +$602 | +0.087% |
| 3 Months | +$3,485 | +0.508% |
| 6 Months | +$22.8k | +3.42% |
| 1 Year | -$2,063 | -0.298% |
| 3 Years | +$230k | +50.2% |
| 5 Years | +$354k | +106% |
| 10 Years | +$482k | +232% |
List My Property
Real Estate Statistics
Financing Solutions
AS SEEN ON


Are You a Licensed Real Estate Agent or Broker?