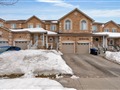
2029 Swan St
$701,871
Comparative Market Analysis
Jul 11, 2025
NOT AN ACTIVE LISTING
Historical Performance
| Period | $ Change | % Change |
| 1 Day | +$498 | +0.071% |
| 7 Days | +$2,041 | +0.292% |
| 30 Days | +$440 | +0.063% |
| 3 Months | +$867 | +0.124% |
| 6 Months | +$21.6k | +3.17% |
| 1 Year | -$1,010 | -0.144% |
| 3 Years | +$203k | +40.8% |
| 5 Years | +$299k | +74.3% |
| 10 Years | +$448k | +176% |
List My Property
Real Estate Statistics
Financing Solutions
AS SEEN ON


Are You a Licensed Real Estate Agent or Broker?