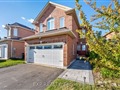
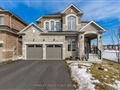
2019 Lilac Dr
$686,965
Comparative Market Analysis
Jun 29, 2025
NOT AN ACTIVE LISTING
Historical Performance
| Period | $ Change | % Change |
| 1 Day | +$230 | +0.034% |
| 7 Days | +$495 | +0.072% |
| 30 Days | +$259 | +0.038% |
| 3 Months | +$2,260 | +0.330% |
| 6 Months | +$19.9k | +2.98% |
| 1 Year | -$9,944 | -1.43% |
| 3 Years | +$201k | +41.5% |
| 5 Years | +$335k | +94.9% |
| 10 Years | +$499k | +266% |
List My Property
Real Estate Statistics
Financing Solutions
AS SEEN ON


Are You a Licensed Real Estate Agent or Broker?